Note: This data set has now been superseded by a new data set on the effects of climate change on global food production under SRES emissions and socio-economic scenarios produced by the same authors. Users are recommended to use the new data instead. SEDAC is maintaining this web site for reference purposes.
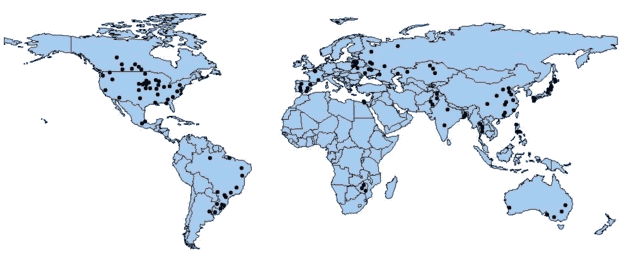
The outputs from three major atmosphere-ocean General Circulation Models (GCMs - also known as Global Climate Models) were used as inputs for crop simulation models at 125 agricultural sites representing major world agricultural regions. These process-based dynamic crop growth models simulate the effects of meteorological variables (e.g., temperature, precipitation, and solar radiation), environmental modifications (e.g. CO2 enrichment), and crop management strategies (e.g., fertilization, irrigation, and timing of labors) on crop physiology and yields. Models were used for the three most significant cereal crops - wheat, rice, and coarse grains (e.g., maize, barley, etc) - which collectively account for over 85% of global cereal exports, and for soy bean, which accounts for 67% of trade in protein cake equivalent. For each GCM scenario (GISS, GFDL and UK Met Office), three levels of farmer adaptation to climate change were assumed:
- No adaptation;
- Level 1 adaptation: changes that imply small additional cost to the farmers and not necessary policy changes, such as shifts in planting dates, variety and crop, and increases in water application to irrigated crops; and
- Level 2 adaptation: higher order adaptations that imply significant additional costs to the farmers, such as large shifts in crop production timing, increased fertilizer application, installation of irrigation systems, and development of new varieties, and/or changes in policy.
Note that the estimated changes in yield under the no adaptation scenario do not consider additional changes that are already anticipated to take place, such as projected future increases in yields due to changes in technology. The adaptation scenarios include different levels of agricultural technology and inputs. The rate of technological innovations considered in adaptation Level 2 is correlated to the economic regional development. For other caveats and to better understand the limitations of the data, read through the data limitations section of this web resource.
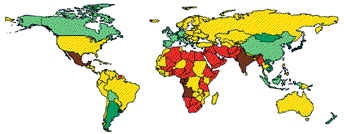
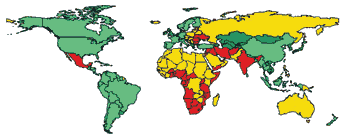
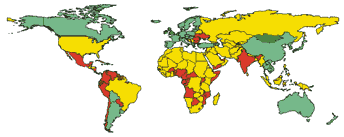
Changes in crop yield by the 2080s, under scenarios of unmitigated emissions
(top),
and those which lead to stabilization of CO2 at 750 ppm (middle) and
550 ppm (bottom).
More on the Basic Linked System
The Basic Linked System (BLS) consists of a set of linked national agricultural sector models. It is comprised of 16 national (including EU) models with a common structure, 4 models with country-specific structure and 14 regional group models. The political changes as well as changes in national boundaries of the very recent past are not in the BLS, although the model formulation has been adjusted away from centrally planned economies to more market-oriented behavior. The 20 models in the first two groups cover approximately 80 percent of world agricultural production; the remaining 20% is covered by the 14 regional models for countries with broadly similar attributes (for example African oil-exporting countries or Latin American high-income exporting countries). The BLS is a general equilibrium model system, with representation of all economic sectors, empirically estimated parameters and no unaccounted supply sources or demand sinks. Countries are linked through trade, world market prices and financial flows.
|
|||||||
| Copyright© 2001. The Trustees of Columbia University in the City of New York. | |||||||