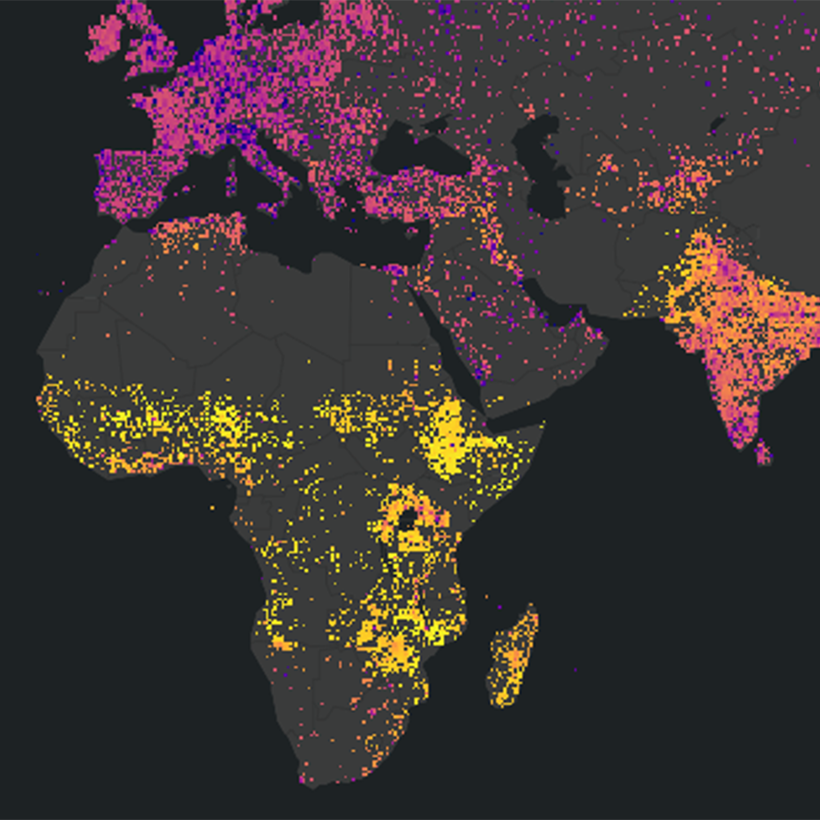
An Esri Story Map describes development of the Global Gridded Relative Deprivation Index (GRDI), a gridded index that depicts areas of relative poverty and deprivation using non-traditional inputs at a higher resolution than previously possible, for the entire world.